
This op-ed was originally published at Tim Adams’ Substack
If you want to know what a Democrat is up to, just listen to what they accuse you of doing. That’s definitely the case when it comes to Kendra Miller, a data analyst employed by Montana Federation of Public Employees. Miller is currently one of two appointed Democrats on the Montana Districting & Apportionment Commission and has taken to social media to accuse Republicans on the Commission of “extreme partisan gerrymanders,” “violating the [state] Constitution,” and “trying to rig the game and steal seats from MT voters.”
After months of work to draw the lines for Montana’s two Congressional seats, the Commission is now meeting to draw the lines for Montana’s 100 House and 50 Senate Legislative seats. Since the balance of power between Republicans and Democrats for ten years depends on how these lines are drawn, Democrats have been forceful and brazen in their calls for maps that gerrymander Montana’s cities and towns with one goal: maintain and expand Democrat power. And that power grab comes at the expense of one group: rural Montanans.
Gerrymandering & Democrat Maps
If you wanted to draw a district to get a Democrat elected, how would you do it? For several cycles now the seats in major urban areas have always been drawn following one script. Find a high concentration of Democratic voters (about 60% of your district goal, usually near a University) and then slowly move absorbing rural areas drawing the map until you have enough people for a safe Democrat district.
Sometimes called “wagon wheeling,” this makes urban centers sometimes look like a wheel with “spokes.” It makes many districts thinner and longer in size since the boundaries are being drawn not for geography or communities that share commonalities, but to achieve a goal of a partisan district that meets minimum population requirements.
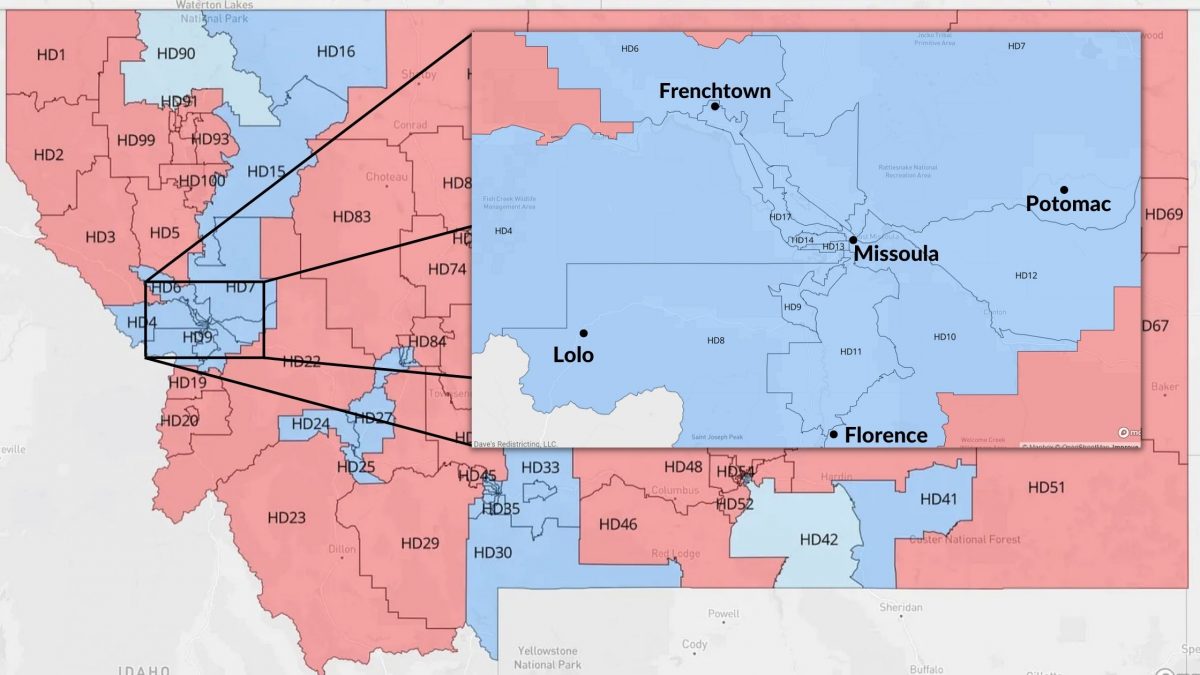
Wagon wheeling and gerrymandering are frowned upon since they are used for only the goal of control, with the interests of the citizens inside the district coming second. Yet, it’s been the major method of drawing maps for those only concerned with unearned power. Miller, one of two partisan Democrats on the Commission, displays this with the maps she submitted to the Commission for adoption. Here’s Missoula under Mrs. Miller’s proposal:
For reference, Missoula County currently covers 12 House seats. The partisan breakup of that is 8 Democrats and 4 Republicans, a split of one-third Republican and two-thirds Democrats. In the 2020 Election, approximately 60 percent of voters cast votes for Democrats while 40 percent cast votes for Republicans.
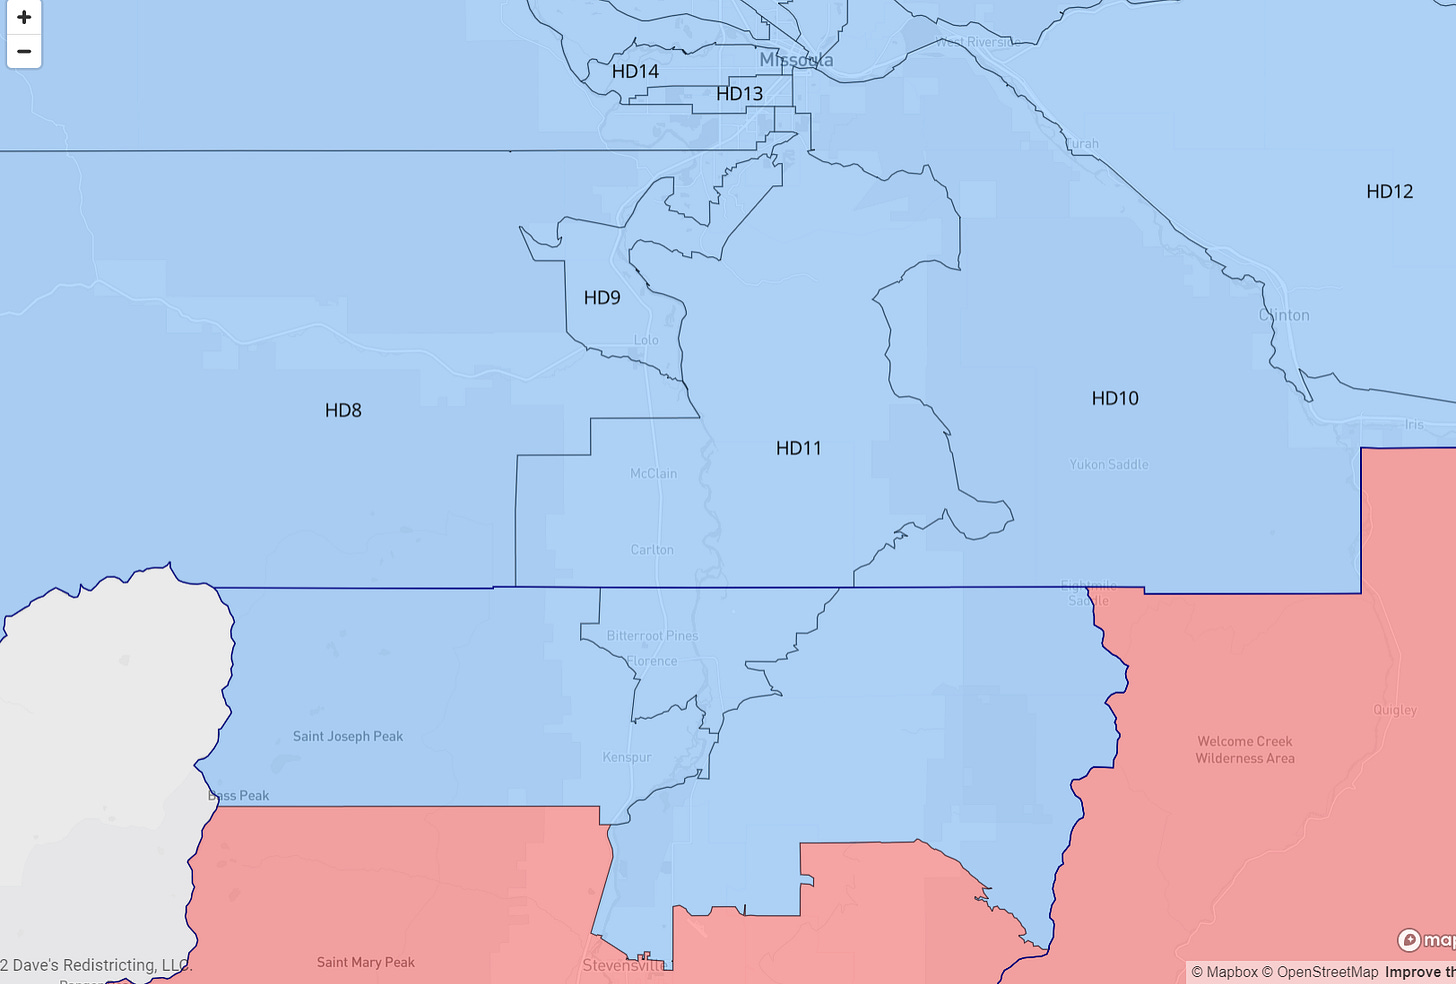
Commissioner Kendra Miller’s map above does have a partisan lean. Here it is with the expected winner by color.
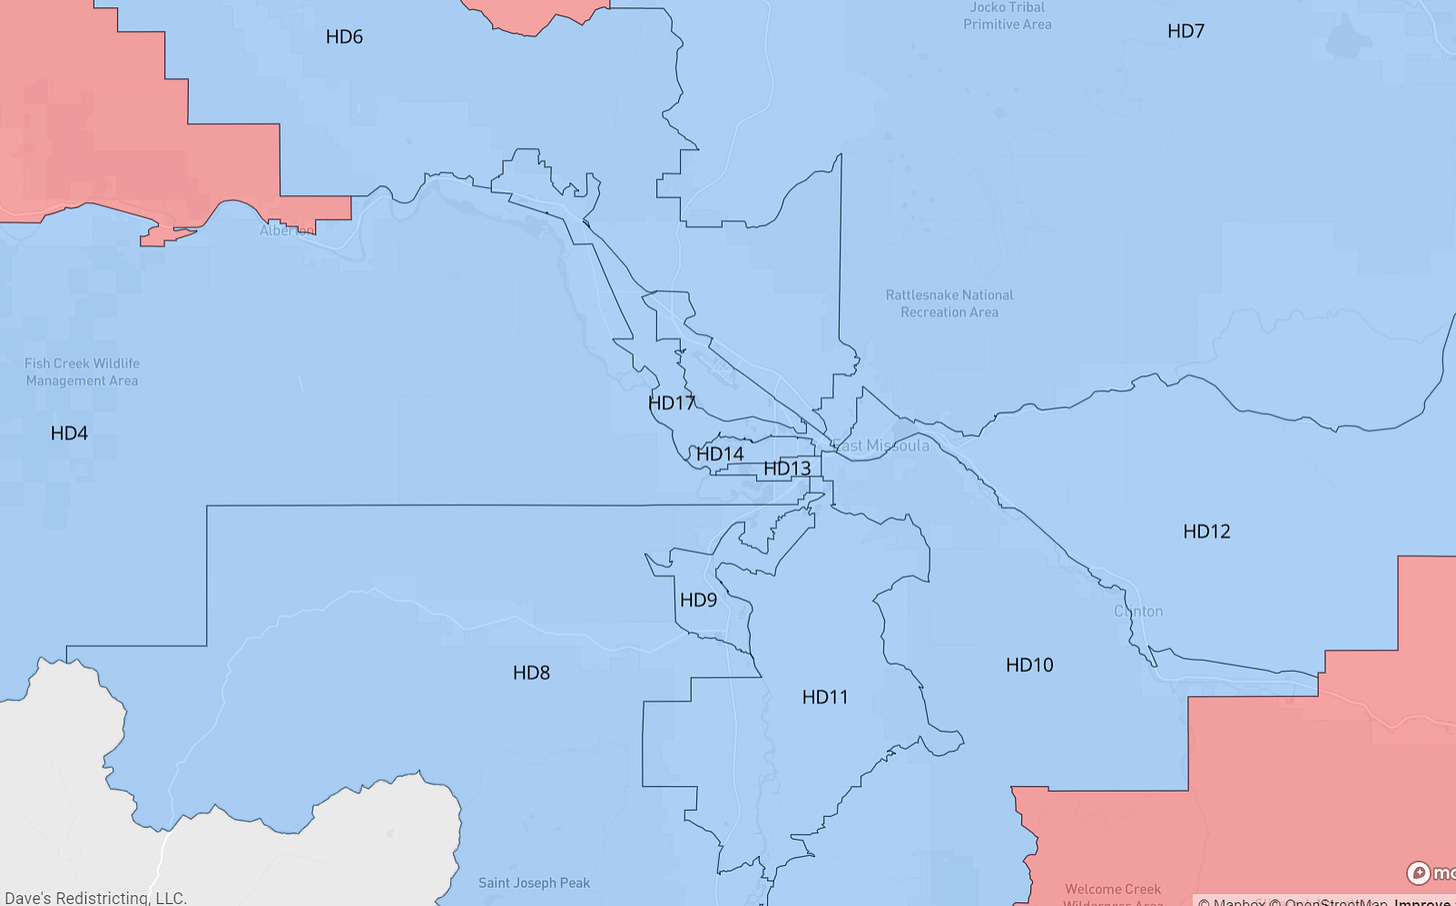
If Commissioner Miller’s map were adopted, House Districts 4, 6, 7, 8, 9, 10, 11, 12, 13, 14, 17 and 18 would all be won by Democrats. Even with 40 percent of Missoula reliably voting Republicans, they would have zero seats in the state legislature.
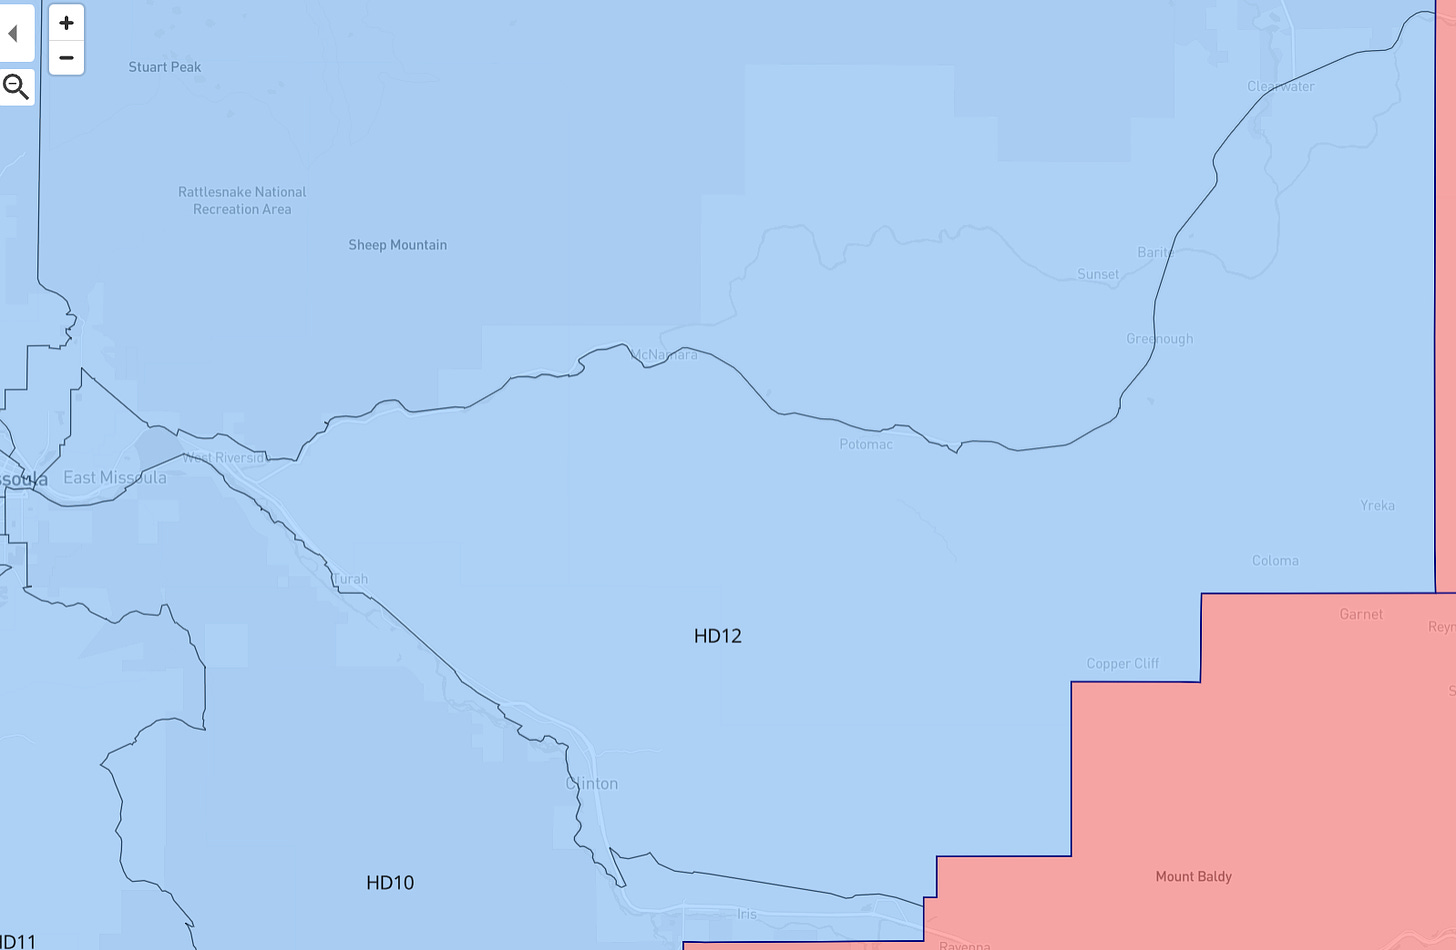
It’s worth noting what Commissioner Miller is endorsing here. In order to draw the districts where Democrats take all 12 seats, they must gerrymander as many rural voters as possible into the most powerless positions. It puts them in the same districts as people who live miles away, sometimes a several hour drive. Here’s a few examples:
Notice HD 17 on the left side of the map. In city limits this district cuts a narrow swath of center Missoula from East Broadway on the river across from the University and then heads west. It conveniently misses all of the Northside of Missoula, North Russell and everything South of the Clark Fork. Then it follows Mullan Road and the river continuing west along the river. We’re not done yet!
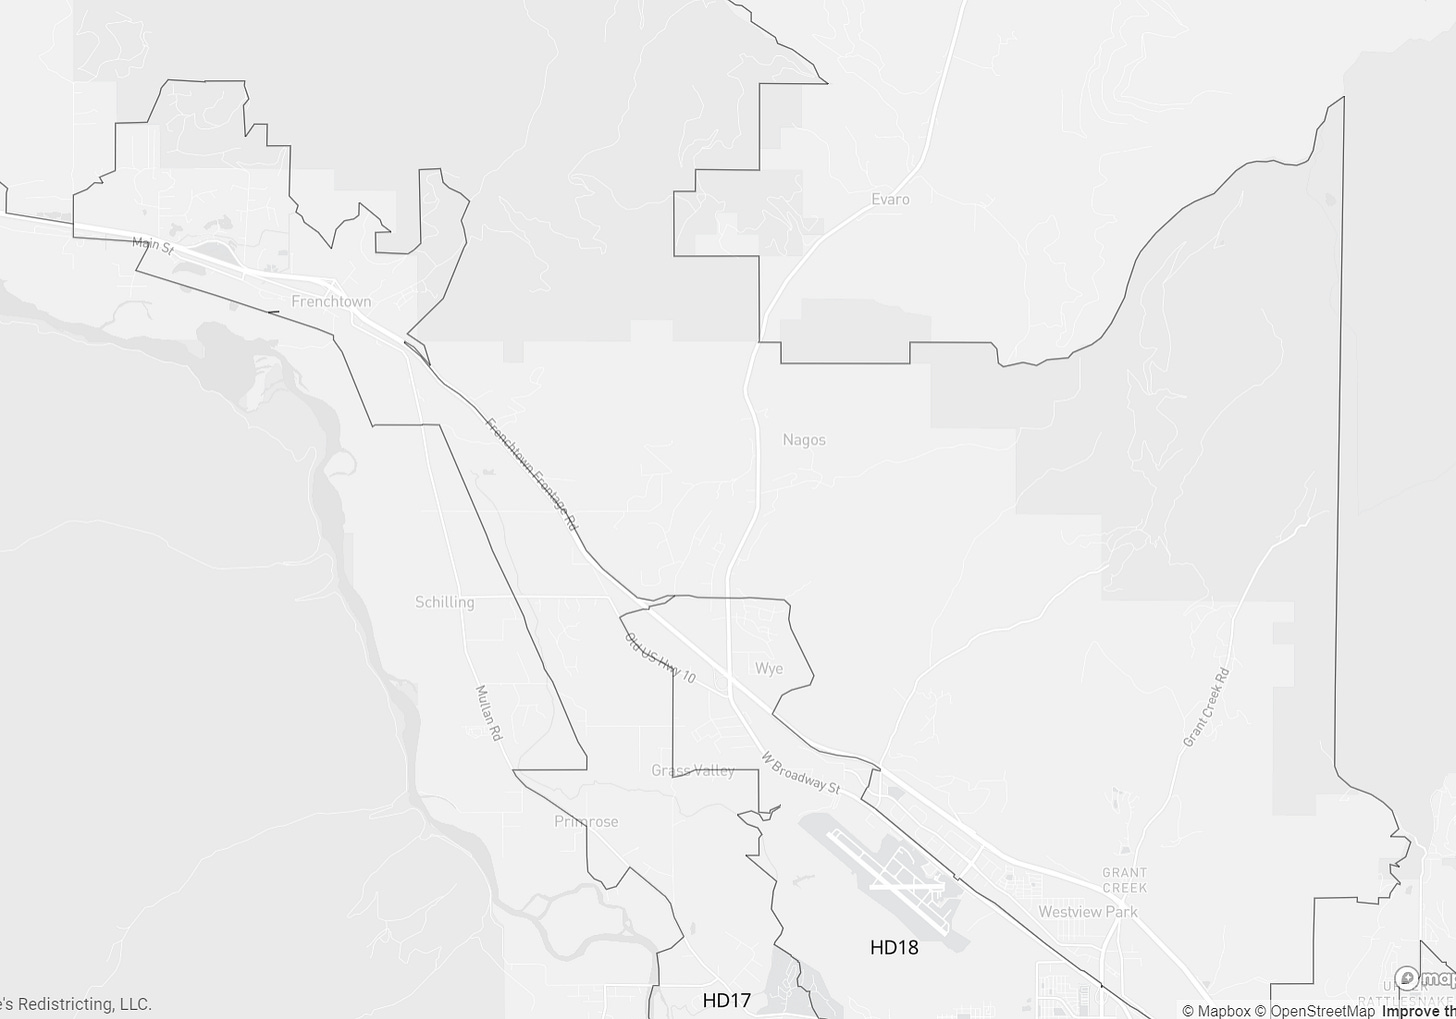
Now HD 17 snakes itself northwest as it narrows on a small strip west of the airport.
Then, voila! It magically expands again around the entire city of Frenchtown!
Frenchtown, like many suburbans and most rural areas, votes mostly conservative. Looking at the totals for President in 2020, 68 percent of votes were cast for the Republican or Libertarian. Only 32 percent of votes were cast for Joe Biden & Democrats. Yet this rural town of only 2,000 will be cannibalized to elect more Democrats. The length of this district runs more than 20 total miles and skips huge areas with much more in common among Missoulians.
More Gerrymandering Missoula
Frenchtown is only one example. Here’s a list of some of the map peculiarities Democrats have included in doing their best to draw themselves as many seats as possible:
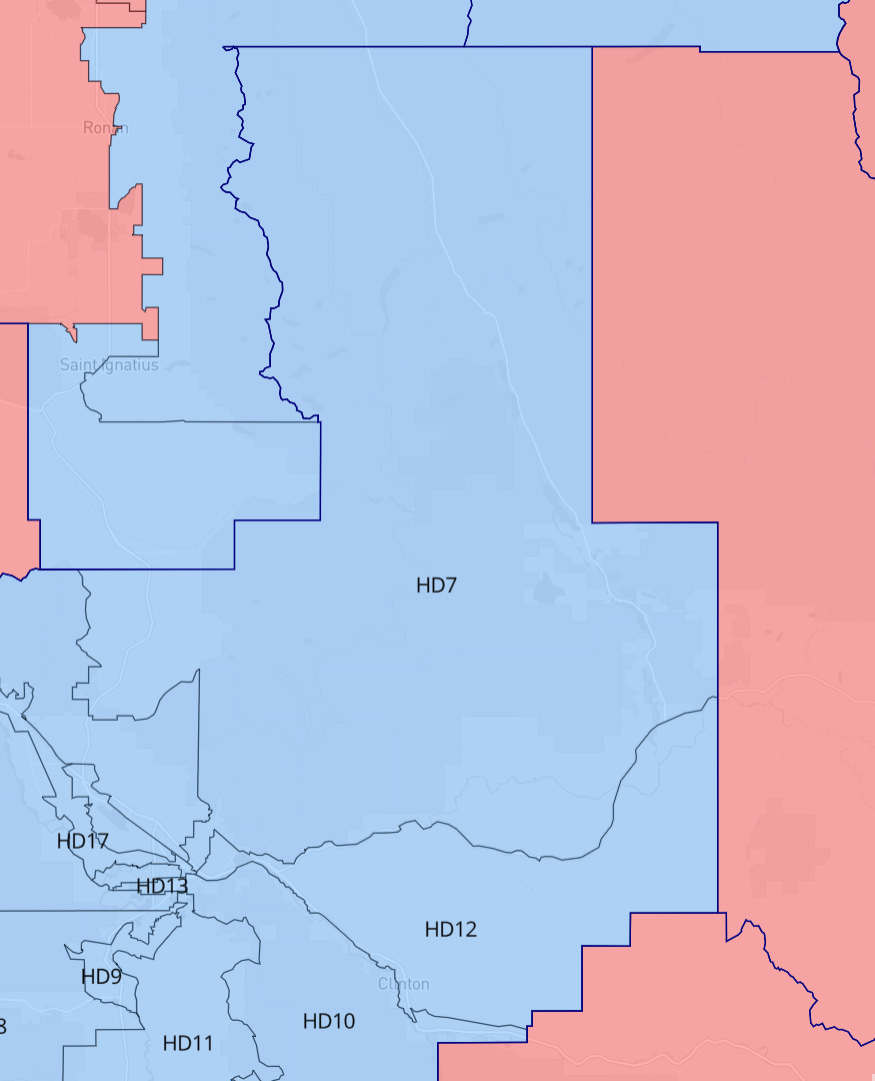
- HD 7: Starts a few blocks north of the University on East Broadway, expands to include the Democratic stronghold of the Rattlesnake, heads northwest to include Evaro/Arlee, heads west to Ravalli (small town at 93N/Hwy200W) and then end touching the area northwest of St. Ignatius. The district also includes Seeley Lake, Condon, and Potomac.

- HD 12: Starts on East Broadway at the Van Buren exit and heads west. Picks up student and government housing between University and East Missoula. Grabs half the Rattlesnake that wasn’t included in HD 7 and uses Hwy 200 eastbound as its northern boundary and most of I-90 for its south border. Like many of the maps, places an arbitrary border that splits communities. Potomac residents north of Hwy 200 live in HD 12 and their neighbors on the south side of the highway in HD 7.
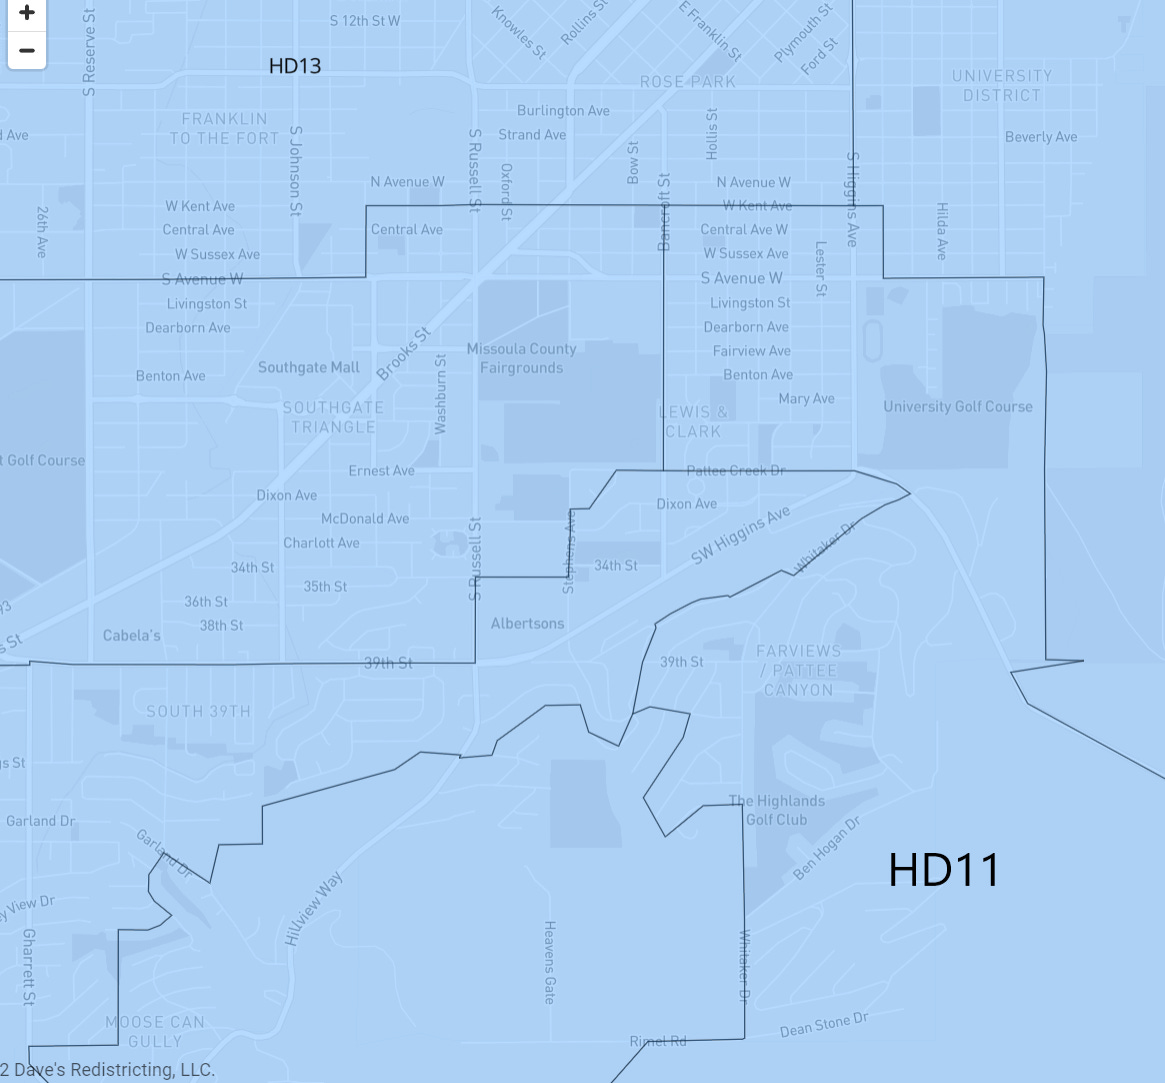
- HD 11: Starts in off-campus University of Montana housing south of the college. After including 7 blocks of residents between the Missoula Fairgrounds and University Golf Course, this district goes south to grab some more Pattee Canyon & South Hills residents before heading south on its way to Florence, where it yet another glob of wealthy Democrats and college students outvote another small area, this time in another county!
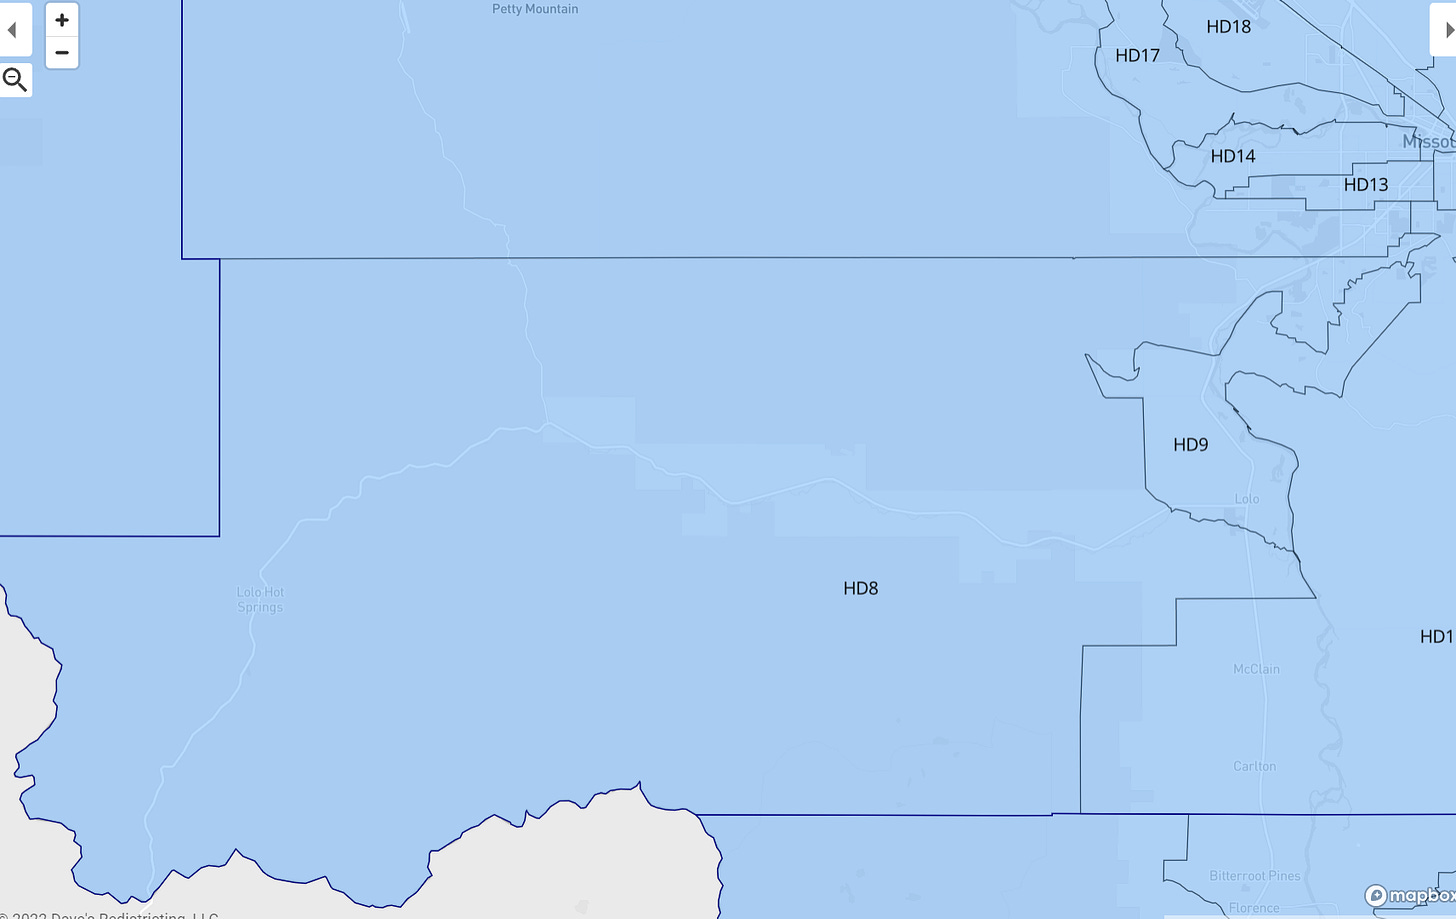
- HD 8: This district starts in Missoula where Higgins turns into SW Higgins and then follows southwest by west. Along the way it grabs a large portion of the South Hills and Miller Creek before hopping on the west side of Hwy 93 S and taking everything west of Lolo (not including, save that for another Missoula gerrymander) all the way to the Idaho border.

I could go through them all, but I think you get the idea. It’s like this in most of the state, using either Universities or Indian reservations as anchors.
What are the parameters for a well drawn map?
When the Districting & Apportionment Committee first met, they established criteria that would be used to guide their decisions. Here’s a screenshot:
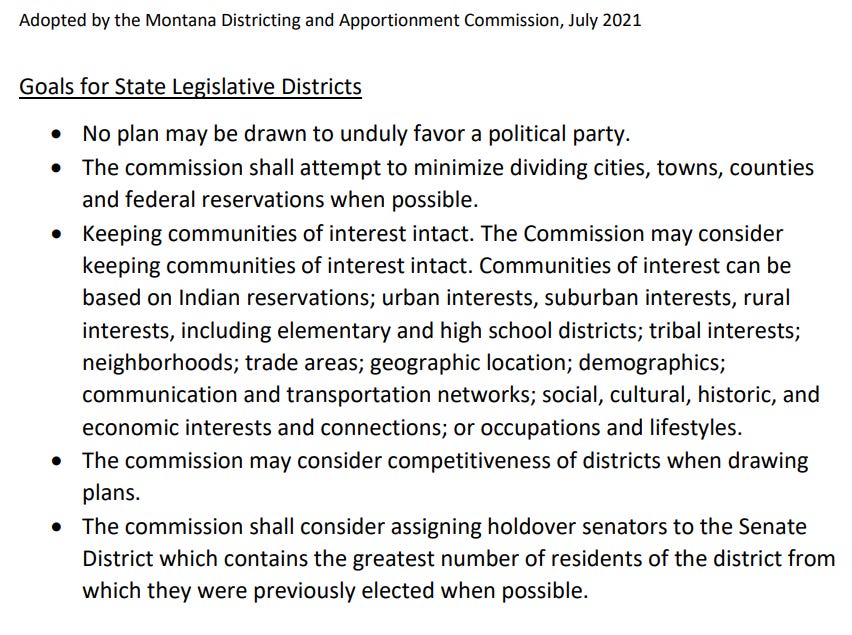
So, the rules as I see them are, don’t draw the map to favor a political party, minimize dividing cities, towns, counties etc., keep communities intact, and the Commission “may consider” competitiveness (not required).
So in order to take a county where 40 percent of residents vote for Republicans and make it a county with 12 Democrat-controlled safe seats, do you think they are doing a good job not drawing the map to favor a party? Do you think they are doing a good job of keeping communities intact by splitting the city limits of Missoula into 12 different House districts?
Not only do 12 districts all start in Missoula city limits and snake in different directions, but the map by Miller also happily crosses county lines to cannibalize rural voters from nearby counties to keep the Missoula districts safe! HD 4 which covers Missoula’s Fairgrounds and Southgate Mall, also extends west through Mineral County to the Idaho border.
HD 7, which includes upper Rattlesnake, crosses into Lake County to grab more votes near St. Igantius and no less than THREE House Districts that include University of Montana and south Missoula all dip into the Republican stronghold of Ravalli county to nab rural voters for safe Democrat seats. When Lake, Mineral and Ravalli counties vote 56 percent, 71 percent and 67 percent, respectively, for Donald Trump, how is it anything but voter disenfranchisement to gerrymander them into safe Missoula Democratic seats?
It’s a bit insane and speaks to the lack of skepticism towards Democrats that they could even put forward these kinds of “extreme partisan gerrymanders” and no one is raising a stink.
Think about it for a moment. What really does a person in the Rattlesnake have in common with a rural rancher west of St. Ignatius? They’re in the same district.
What would a rancher living north of Hwy 200 in Potomac have in common with their neighbor on the south side of the highway? Per Democrats, different districts.
What do residents of the entire town of Florence in Ravalli County have in common with students living in student housing by the golf court in Missoula county? Same district.
Missoula residents who live, work or study near the University would be split up in 6-8 different districts just by going on a walk near their house. And by Democrat’s logic, this is on purpose because they have more in common with rural people, some who live hours away, than their neighbors in their own city.
Is this democracy? Is this equal representation?
Is this preserving “communities of interest?”
Rural residents usually have entirely different outlooks and priorities on government. Most prefer paying less taxes and relying on neighbors and themselves. Most are older, many on fixed incomes. They also tend to be more working class and make less money. They are affected most by things like inflation since driving is a necessary expense of country living.
So why are they disposable to Montana Democrats? Why, when given the chance, does a paid data consultant from Bozeman decide she’d rather take all 12 seats in Missoula and disenfranchise residents of 3 more counties to pad her lead? The current Missoula districts include 6-7 safe Democrat seats, 2-3 safe Republican seats and 1-2 competitive seats. This matches closely to the representation of the county. Yet, Miller will eliminate all the Republican seats, all the competitive seats and even take more rural voters away from districts where their voices might have a chance at being heard.
Miller is right that the Commission is subject to extreme gerrymandering. Too bad her fingerprints are all over it.
Are the Republicans Crazy?
Now contrast this with Republican Commissioner Stusek’s map of Missoula:
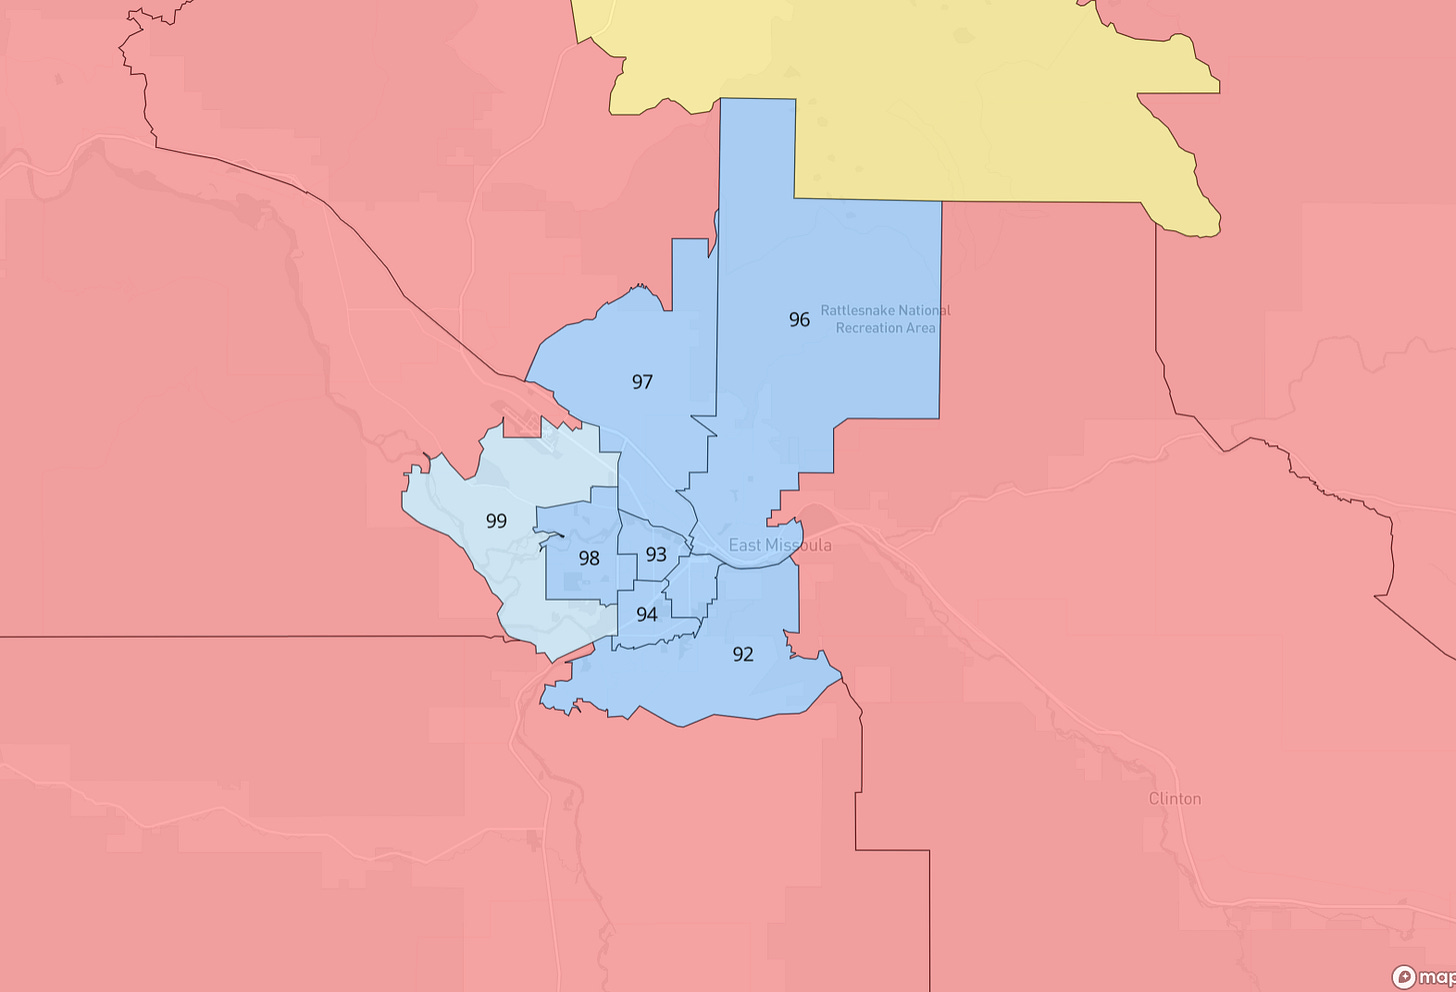
The city is more uniform. The districts look more like squares or circles than thin lines going on adventures. People in urban/suburban areas are represented by Democrats and people in suburban/rural areas are in competitive or safe Republican districts. Democrats have 7-8 safe seats, Republicans have 4 safe seats and 2 look to be competitive. Not much change from the current situation and residents of rural areas aren’t outvoted by people who live in different cities and counties. Very little cross-over unless needed for population, and is then done only as necessary, not to skew the tilt of the district to Democrats.
Here’s longtime Montana Republican Jeff Essmann’s map:
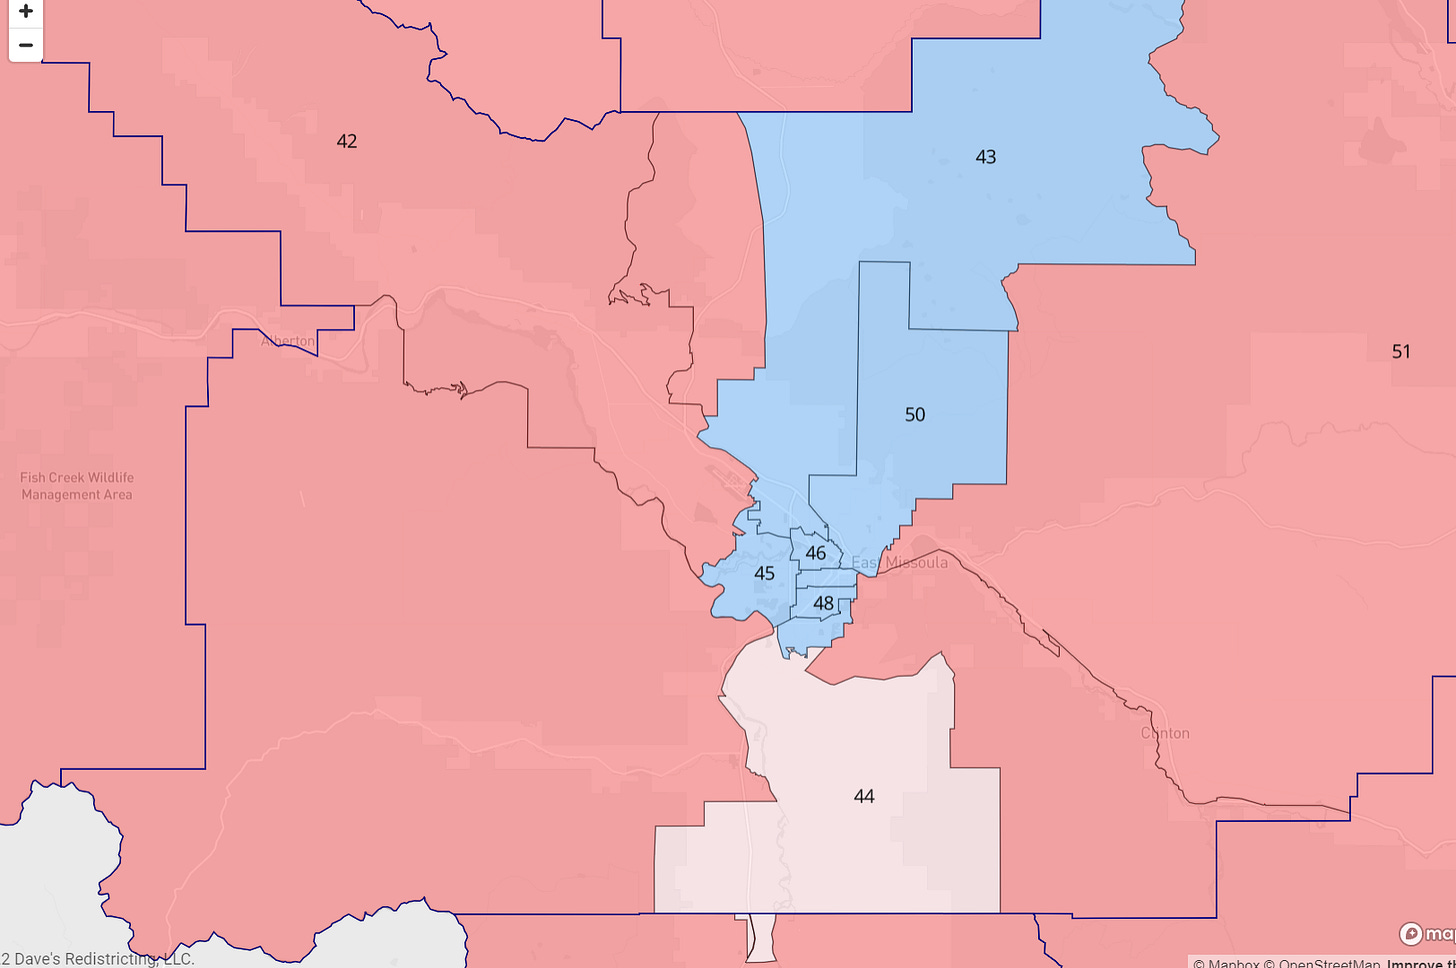
Essmann’s map is a bit bolder for Republicans in Missoula. Only 7 House Districts are safe Democrat, while 5 appear safe Republican and 1 is competitive/swing.
Given the job involved and the amount of public trust that goes into the result of this work, I’d say the Republicans are pretty fair in their maps. I don’t think they are unreasonable and to accuse someone of “partisan gerrymandering,” “stealing MT votes,” “hurting tribal communities,” and all the other talking points Miller has memorized to say is pretty bold.
Talk to me about Boz Angeles
Bozeman doesn’t look much better. For reference, Gallatin County voted 52 percent for Biden in 2020, 45 percent for Trump and 3 percent Libertarian. There are 11 House districts in the county, 6 of which are held by Democrats and 5 by Republicans. Pretty equal split that approximately represents the voting trends of the area. Here’s what Miller wants it to look like:
Democrat Miller’s map (above) again uses narrow corridors that start in Bozeman city limits and snake out to areas like Springhill, Bozeman Airport, Belgrade, Four Corners etc. You get the idea. Start close to Montana State and then rope in rural voters from as far away as possible. This makes a total of 9 safe Democrat and 2 safe Republicans for the total of 10.
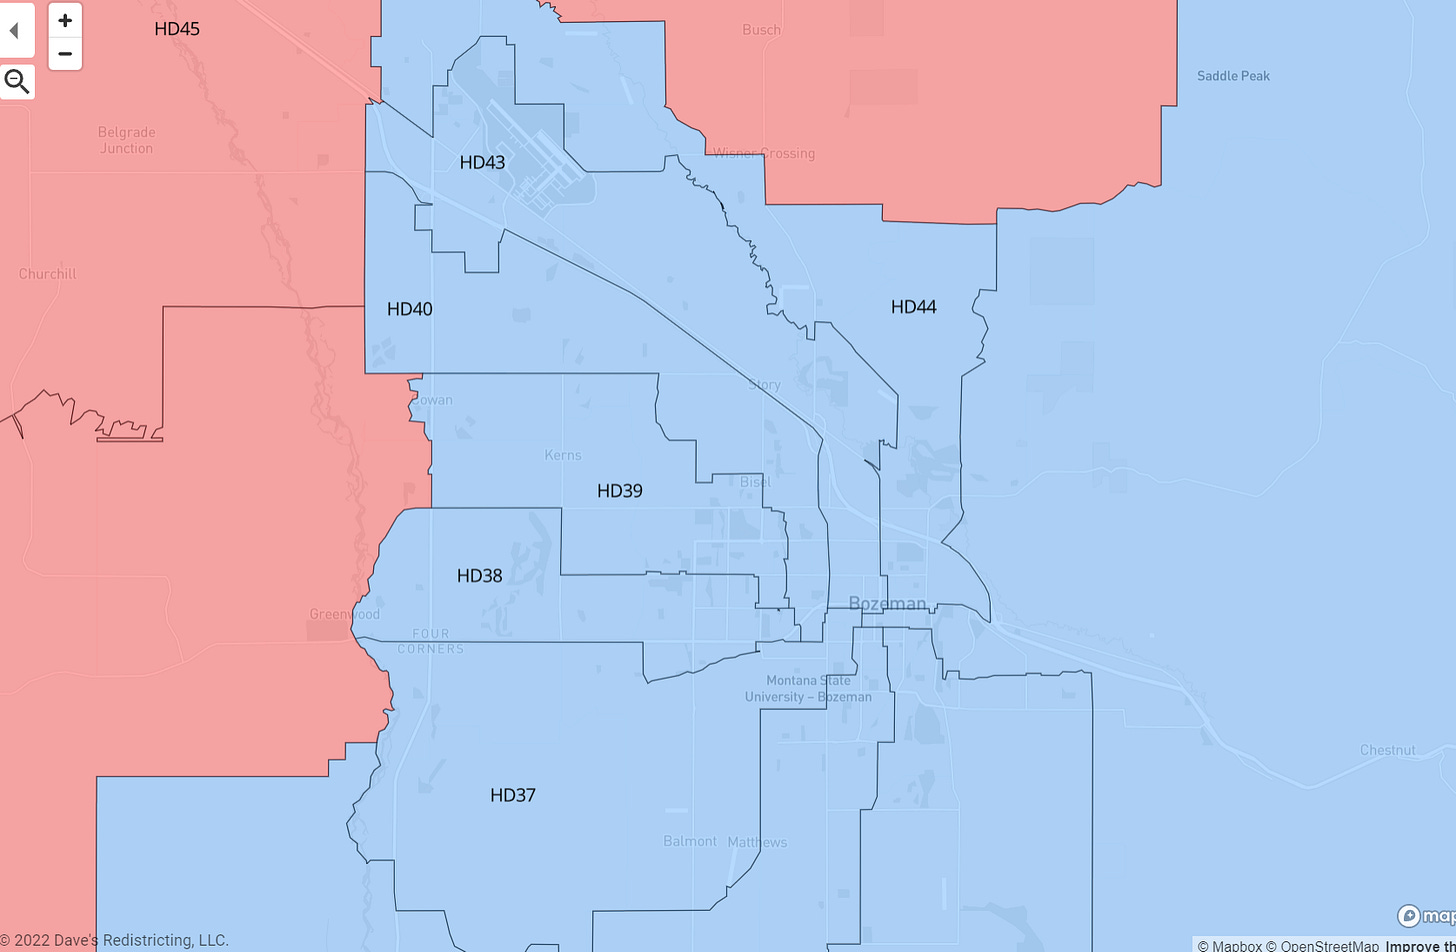
Here’s Republican Stusek’s map.
While the area around the airport still borders 3 districts, they don’t all three run over to Bozeman to grab solid Democrat voters. This map has 6 safe Democrat seats, 5 safe Republican seats and 1 swing.
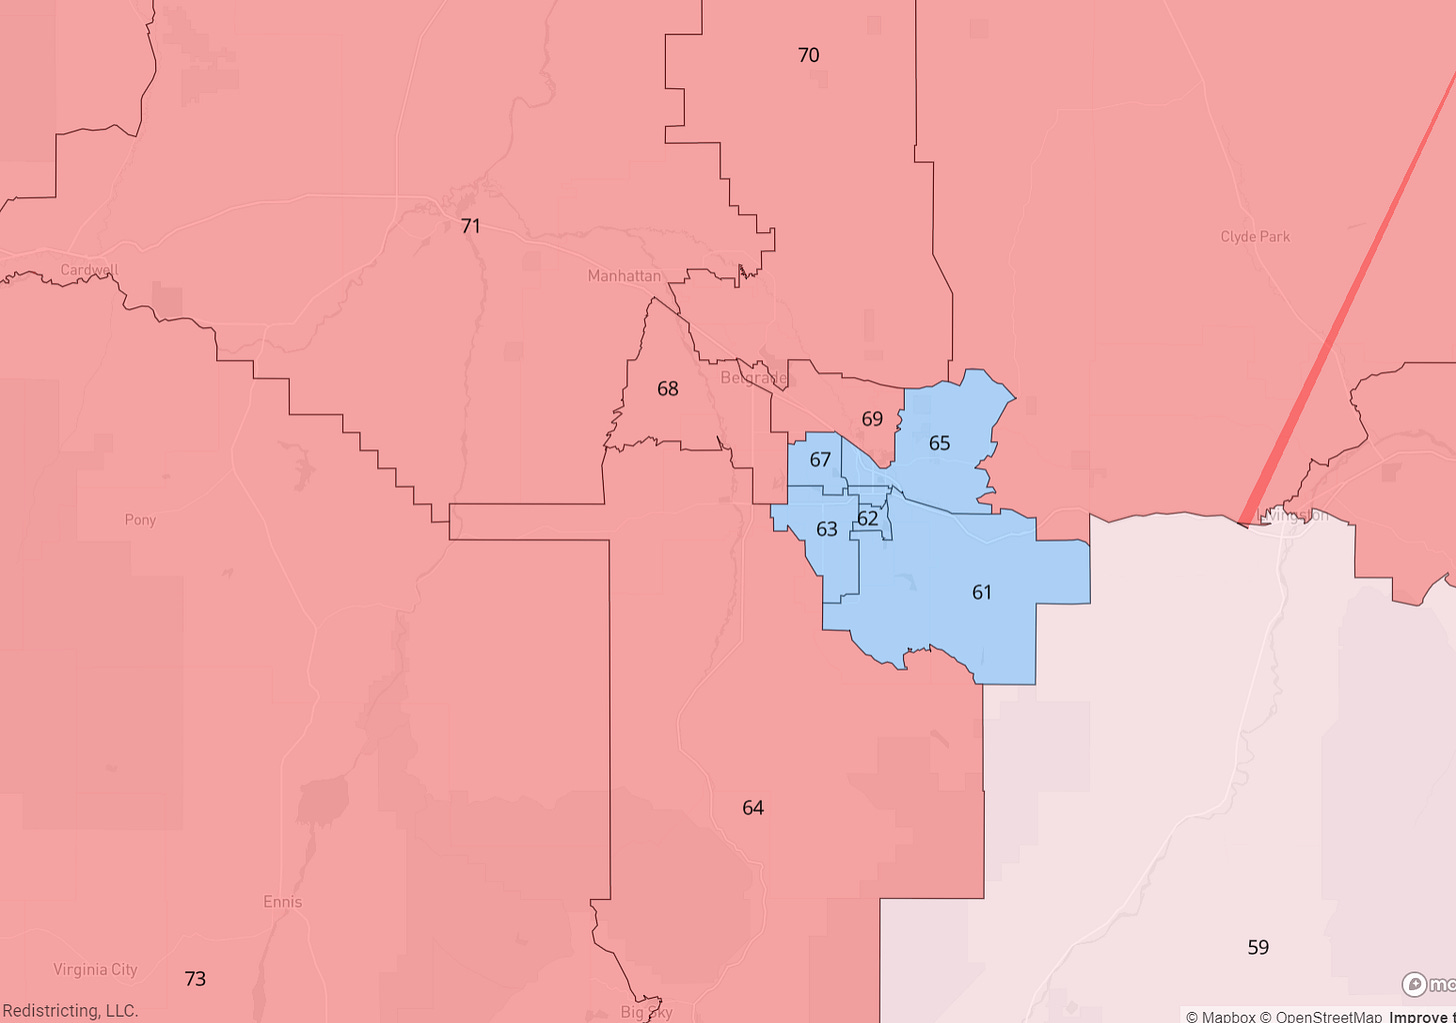
Let me show you one more map before I wrap up. Here’s a larger view of Gallatin County and the surrounding areas from Democrat Miller.
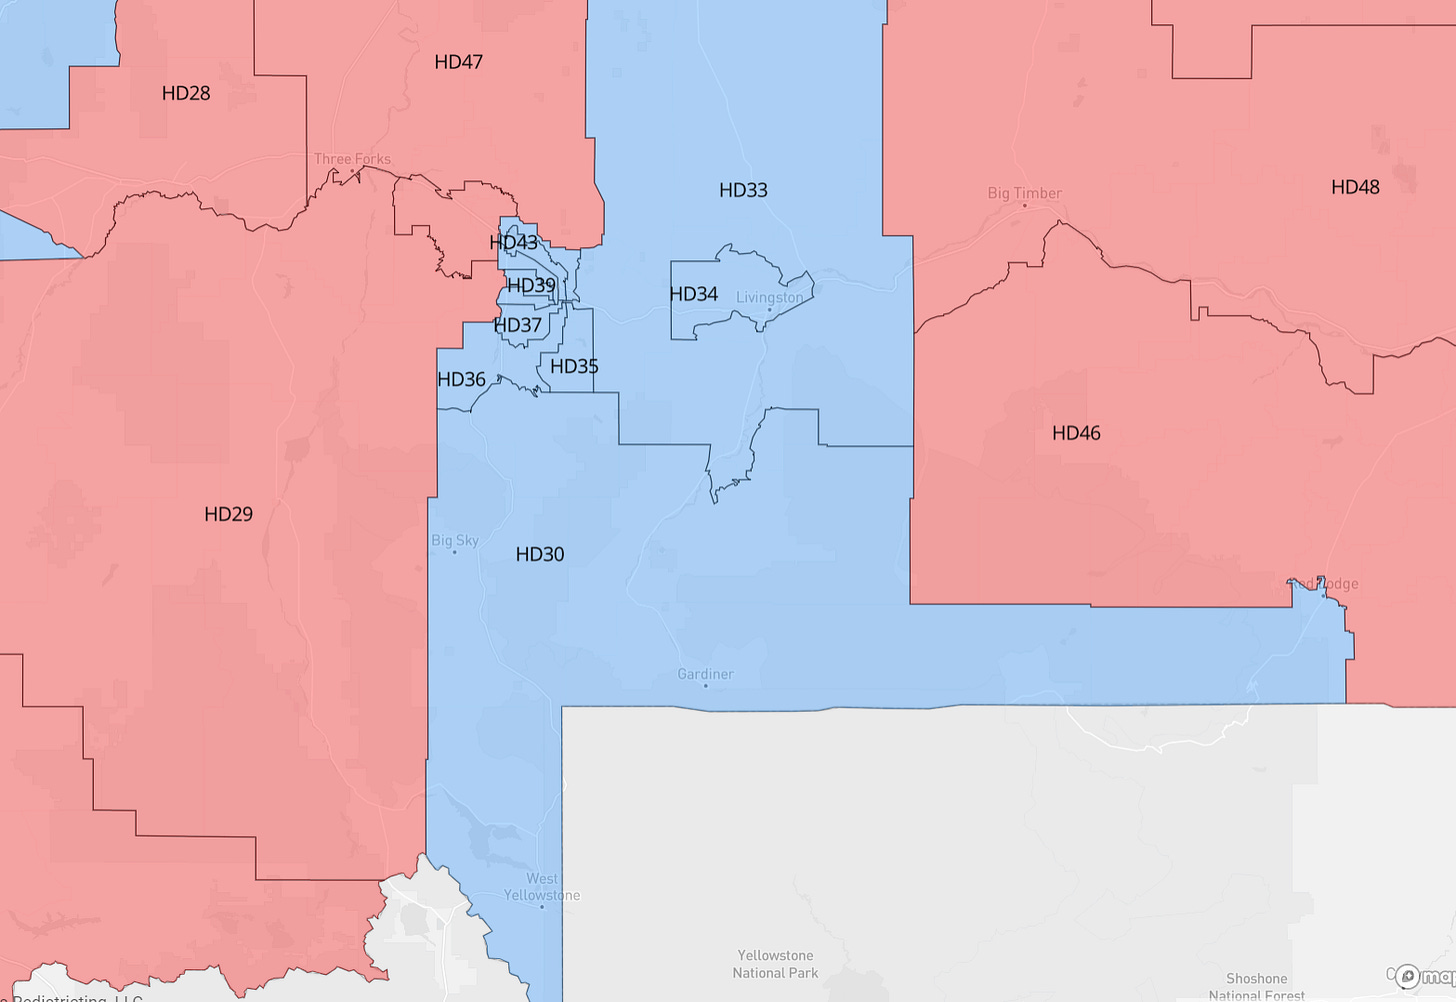
In order to draw safe Democratic seats, Livingston (in neighboring Park County) is one safe Democrat seat and the surrounding rural areas are gerrymandered into downtown Bozeman to South 11th Ave. Yes, according to Miller and Democrats well-off Bozemanites and students who can walk to the University belong more with the rural residents of Clyde Park an hour away than with their own classmates living a few blocks away in different districts.
Additionally, in order to draw more safe Democrat seats, they again violate the provisions against drawing people in different counties. Not ones to let a rich bedroom community go to waste for votes, Democrats put the residents of West Yellowstone and Big Sky with Red Lodge in Carbon County. This large district also includes HALF of Park County. A candidate who wanted to talk to voters would have to drive a full FOUR HOURS from Red Lodge to West Yellowstone. In making this drive, the candidate would pass through no less than ELEVEN other separately drawn House districts and two more counties to reach his same constituents in the first district.
This doesn’t seem crazy to anyone?
“It needs to be competitive!”
One of the main arguments in favor of the Democratically gerrymandered maps has been that more competitive or swing districts being drawn means more voter engagement. Yet, when you analyze the maps there is almost no real difference in the number of competitive districts between the Republican and Democrat proposals.
Commissioner Kendra Miller provided analysis of how her districts would break down if implemented.
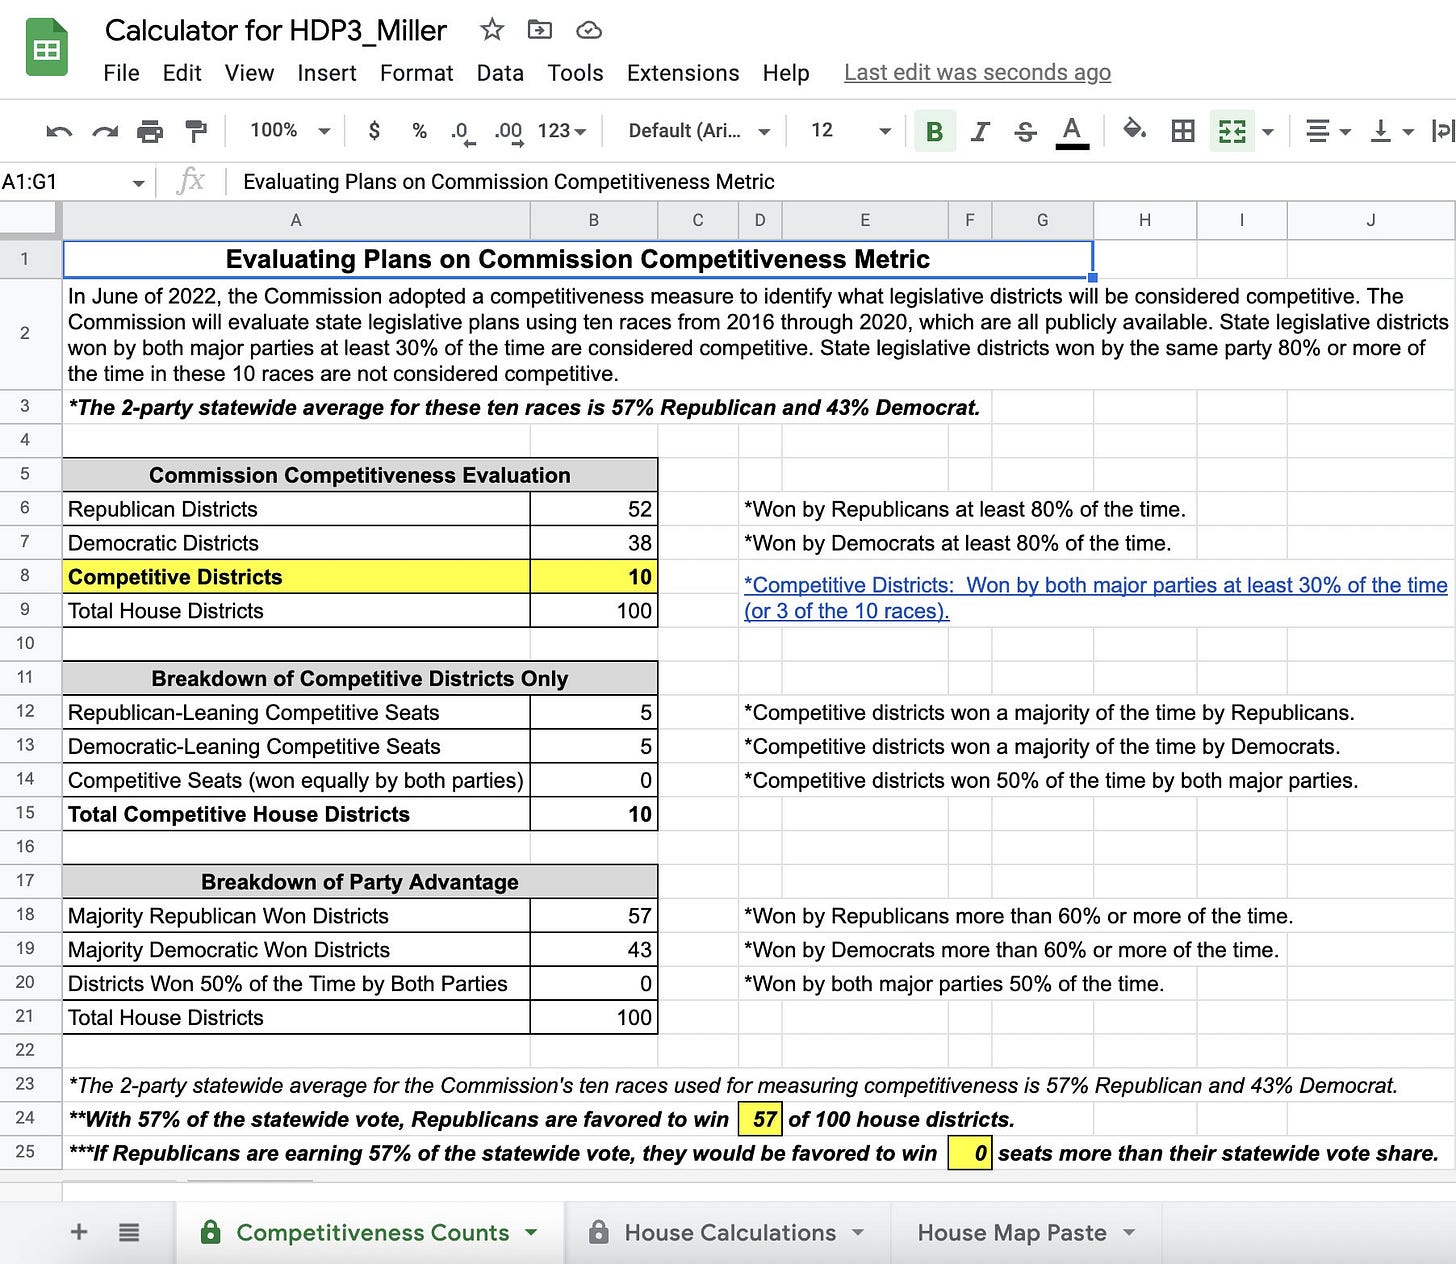
By Miller’s own analysis, her own map would give Republicans a 52-38 edge in safe seats, with the remaining 10 being “competitive.” Democratic Commissioner Joe Lamson’s map proposal arrives at the same proposal, 52-38 split with 10 competitive swing districts.
How do the Republicans maps do for number of “competitive” districts? Here’s Miller’s analysis:
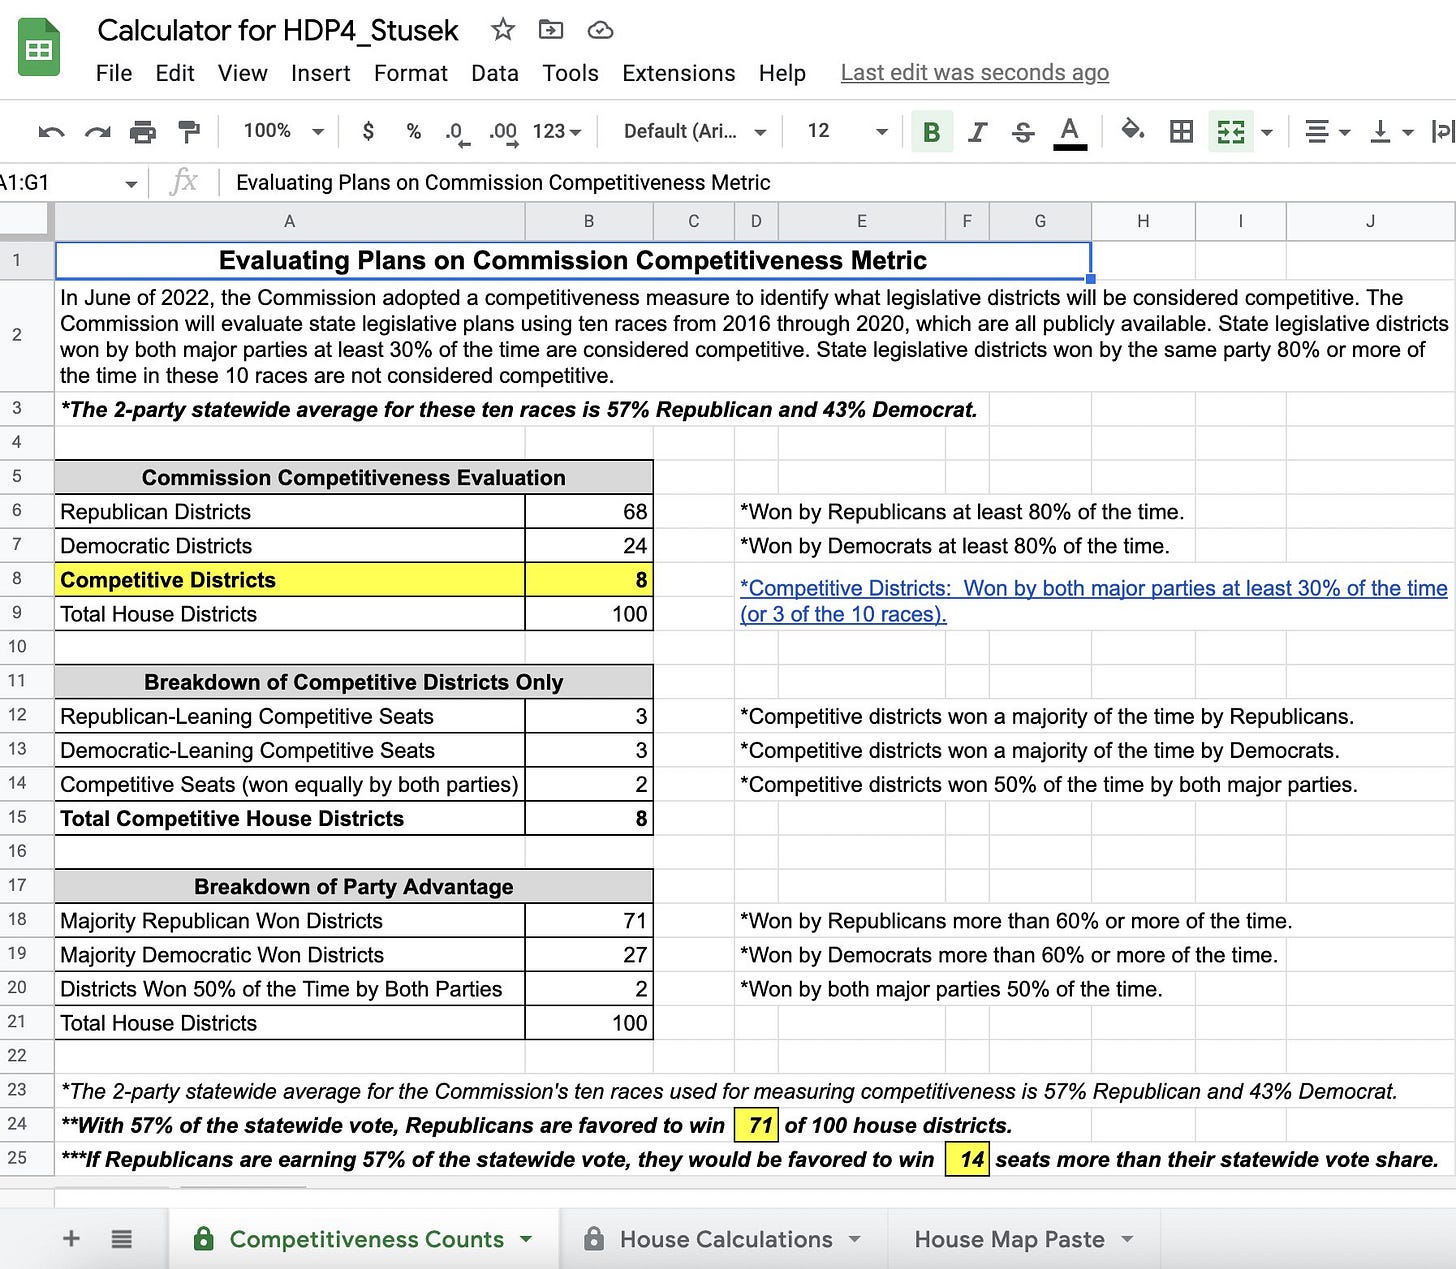
If Stusek’s map is adopted, Republicans start with 68 safe seats to 24 for Democrats. This leaves a total of 8 competitive “swing” seats. If Essmann’s map is used, 66 seats are safe Republican, 26 are safe Democrat and again, 8 are swing.
What does this mean? It means that no matter whether you use a Republican or Democrat map you don’t get more than 8-10 competitive seats. That means if you used “competitive” as a metric, it becomes a wash between the maps proposals. This actually matches trends I observed in the 2014 campaign when 8-11% of Montanans were reliably ticket-splitting voters.
Computer Says No
Even the computer program being used shows almost no difference in competitiveness. Here’s analysis from the software being used that ranks different metrics to keep them in balance. Here’s Miller’s map’s rating:
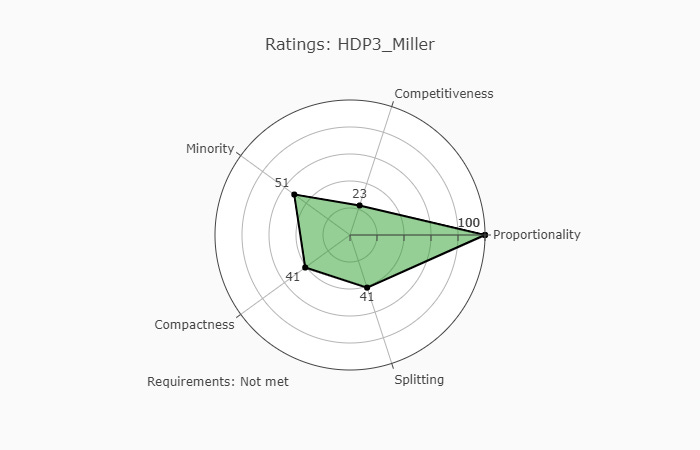
Here’s Stusek’s:
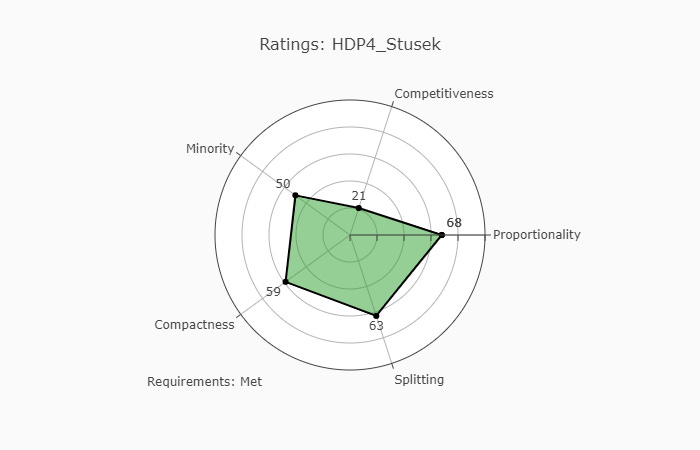
So Stusek scores a 21 on competitiveness per the computer they’re all using (even other states), and Miller scores a 23. So we’re going to gerrymander 25 or so seats to get a 2 point improvement in “competitiveness.”
By the computer, the minority inclusion score is gives Miller one more point, 51 Miller vs 50 Stusek. Yet, when it comes to compactness of districts, Stusek’s map wins by almost twenty points, 59 to 41! The split district score (higher means less splitting people up), Stusek’s map outcompetes by 22 points.
Problems of Measurement
Commissioners in June adopted results from past statewide votes in 2016, 2018 and 2020 as a baseline for asserting that Republicans should receive approximately 57 percent of the House Districts since they received an average of 57 percent of the statewide votes. However, this is a poor metric to draw districts in the first place. If you want a more accurate measure of each county ( and I want to address why. Here is the list of races Democrats use to come up with this.
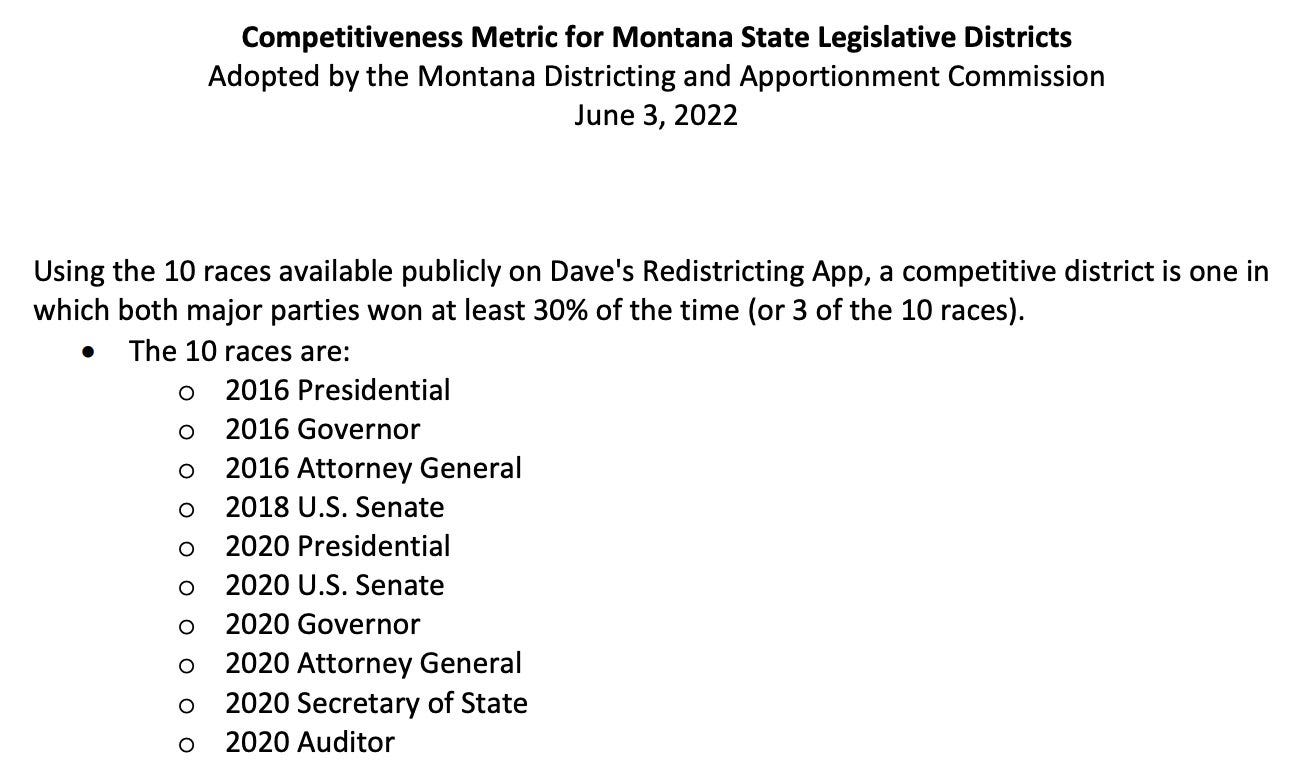
Every operation/measurement/mathematical model has both upsides and downsides. Average is a metric which is often misused, and I think it is done again in this case. Here’s why.
When you take a measurement of a whole, like the votes in the state of Montana, you are getting small aggregations of smaller pieces. The false assumption being made here is because you see a feature of the whole, ie “an average of all statewide votes for past 3 elections,” this gives you information about the House districts, which are each only one percent of the whole. (100% / 100 districts ~ 1% per district)
The reality is when you start breaking any large population into smaller bits you are going to see much more variability. When you see a poll, you see a corresponding “Margin of Error.” Politicians from smaller areas or who represent smaller populations tend to have more extreme views. This is why small-town Republicans go after yoga pants and Missoula Democrats want Amtrak trains while Bullock, Gianforte, Daines and Tester have to be more moderate to represent a geographically large state with a larger population of more diverse interests.
Think about it. We aren’t trying to draw one map for all of Montana. We are trying to draw 100 maps for 100 different parts. As we’ve shown by the large difference in the outcomes from different Commissioner’s maps, how you draw the map has a large effect on the outcome. To only say the final map needs to give Republicans about 52-57 seats is a false extrapolation and purely partisan endpoint. We have much better, more granular data about our state and we should use demographic, geographic and voting data in a better way to serve all of the public, not just those living in central Missoula or Bozeman.
And the fact is, when we draw ALL FOUR of these maps with a diverse set of goals, we still don’t get more than 8-10 competitive seats anywhere. This aligns with expectations of moderate/ticket splitting voters, so it’s probably a good assumption that unless we really get nuts, there aren’t maps out there that change the total number of swing/competitive seats possible.
We’re All College Students Now!
As has now been shown, depending on your motivation, metrics and what you are ok with prioritizing can drastically change the way the maps look. Even with the same data on households, voting and geography you could apparently give Republicans anywhere from 52 to 76 seats in the legislature.
Montana Democrats have had a rough few election cycles. A little over ten years ago they were electing a Democrat governor to his third term and had even just gotten ties and slim majorities in the state House and Senate. However, they’ve lost almost all statewide races in the last two cycles and now mostly just hold seats in their urban strongholds like Missoula and Bozeman. If the electorate is becoming older and more conservative, shouldn’t that be reflected in these map updates?
Additionally, much of the population centers that Democrats rely on for voters have huge transitory populations that often change drastically every 4-6 years, giving residents with less time in the state a stronger voice. Start with the thousands of college students at UM and MSU. Democratic Party-aligned groups like Forward Montana use dark money to register and assist in making sure this Democratic bloc always has their voice heard.
Many professionals cycle in and out of these areas as they are attracted to the scenery and low crime, but then check out after a tough winter or become sick of the expensive cost of living. As a result, areas of Montana where outsiders, new and temporary residents cycle through have become too expensive for locals and long-time residents. As outsiders cycle in and out of Missoula and Bozeman, taxes and costs of living keep increasing, squeezing rural and longtime residents more.
So What Should I Do?
The maps proposed by Democrats are a disgrace. Most likely developed on a computer somewhere in D.C. and handed to a partisan who would shriek the loudest. The reality is the lines they draw silence and disenfranchise Montanans not just in Democratic strongholds, but anywhere close enough to be included near a university, even if it’s hundreds of miles away.
The Montana Districting and Apportionment Commission is meeting this weekend and wants public input on these maps!
Here’s the information on the upcoming meeting!
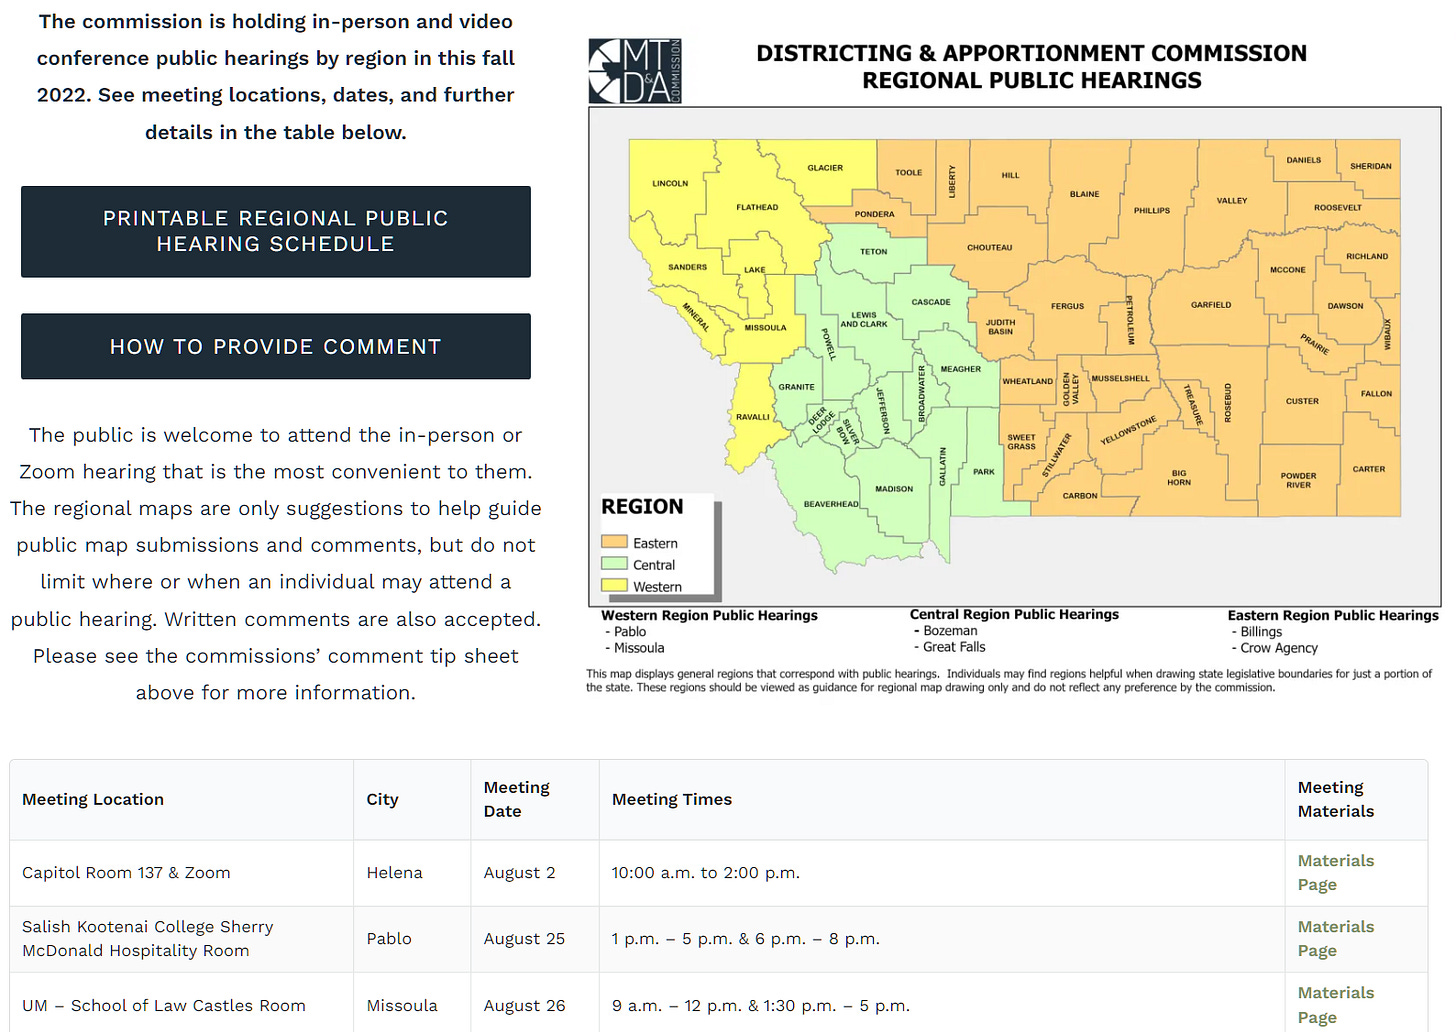
Please consider sending a short note asking the Commissioners NOT to consider the Democratically draw maps submitted by Lamson and Miller.
Peruse through Essmann and Stusek’s (or all four) and see where you fit. Think of how this might affect you, both positive and negative.
If you want to address some of the issues I’ve raised in this piece, here’s a shortened summary of important points to make to the Commission:
- The maps proposed by Democrats are blatant power grabs that gerrymander Montanans only into the districts that gain Democrats the most power. They do not follow the prescribed parameters of avoiding partisanship, avoiding splitting communities of interest and splitting towns/cities/counties.
- The Democrats’ map doesn’t meet their own parameters. Whether you use any of the four commissioners maps, your net number of competitive seats only changes by 2 out of 100. The only thing different in the proposals is the number of safe Democratic seats. Yet, Democratic maps exchange continuity, compactness and commonalities of residents to win Democrat seats.
- These maps erase the political voices of rural residents, particularly in the areas and counties surrounding Democratic stronghold such as Missoula and Bozeman. While both these areas’ current House districts give an approximately split of their observed voter patterns, the new maps proposed by Democrats completely eliminate almost all Republican representation in lieu of gathering more rural residents, some in other counties, to draw safe Democrat seats. This is unacceptable and against the stated purpose of nonpartisanship.
- Democrat maps place as many as 8-12 districts together anchored in a single Democrat stronghold. This means city residents who are mostly homogenous are no longer drawn by who their neighbors are, but by how they vote. Rural residents’ concerns will be minimized and not represented in the state legislature in favor of cosmopolitans and college students who often move away soon after voting. The rural/urban divide will continue to grow and cause resentment as suburban and rural residents struggle for a voice in the legislature.
- Continuing to give more and more political power to Democrat strongholds at the cost of rural residents further exacerbates our current problems of rising costs-of-living, rising taxes, housing affordability etc. Giving college students and transitory residents a voice and silencing long-time Montanans and rural residents only subjects more people to the mismanagement and unaddressed issues going on in our urban centers. Leaders who prefer power over responsibility and who willingly disenfranchise rural, older and longtime residents shouldn’t be given more power in the legislature.
Comments
2 responses to “Montana Democrats Disenfranchise Rural Voters”
They should not get anymore power. Missoula is full of liberals who have helped make that community a terrible place to drive in. The architecture with new buildings is hideous and most of the libs don’t mind living on top of one another because that is how is was where they came from. A once beautiful town has been turned into a craphole. I lived there for over 20 years and refuse to spend one dime there. Kalispell is hanging on by a thread, but at least the city fathers had some common sense and it is not ugly. It’s a shame this was allowed to happen in Missoula.
Tim, thank you for your work on this. I really appreciate it.